 |
|
| Home | |
| Victor Hess | |
| Auger Project | |
| Coord.systems | |
| Terrestrial | |
| Galactic | |
| Celestial | |
| Space weather | |
| Unix Time | |
| Projects | |
| Ask me | |
| Contact | |
Plot with Aitoff projection
- Load the data of the ASCII-file (with all events) from http://auger.colostate.edu/ED/ into the Excel spread sheet
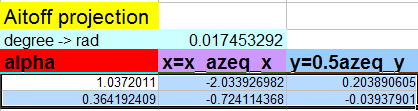
- Label your Excel spreadsheet as in the following picture:
- You will need to put the following formulas into the Excel spreadsheet:
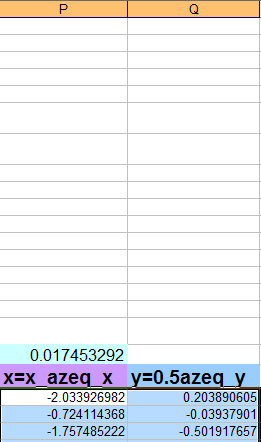
- Mark cells O20 to Q20 and transfer the equations to cells below as shown here
- Mark all cells which show the values for the coordinates in Aitoff projection (1: mark first cell 2: hold down the "shift key" 3:mark last cell
- Activate the plot tool: go to "Insert" and select "X Y Scatter plot" in the menu bar
- A chart with your data will show up in your spreadsheet
- Click on the chart and select the corresponding chart layout in the menu bar
- You can modify "axis title" and "chart title" by clicking on the labels
- Double click on the axis to adjust the axis options if necessary
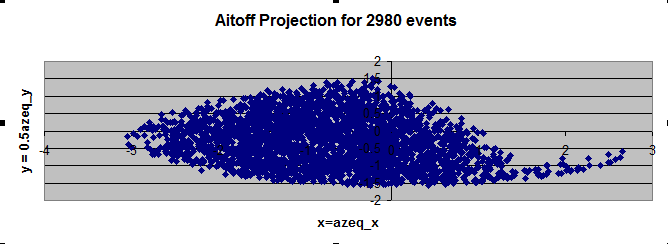
- Your final plot will look like this (only few events included):
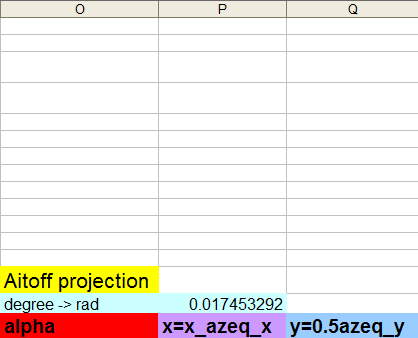
in cell P18: =PI()/180
in cell O20: =ARCCOS(COS(H20*$P$18)*COS(G20*$P$18/2))
in cell P20: =2*COS(H20*$P$18)*SIN(G20*$P$18/2)*O20/SIN(O20)
in cell Q20: =(SIN(H20*$P$18))*O20/SIN(O20)
note:
column G contains the values for the galactic longitude beginning at field G20
column H contains the values for the galactic latitude beginning at field H20